Cycling in Scotland up 46% in a decade, but distance and “the weather” keeping many off bikes
A Cycling Scotland report detailing everything from participation levels to road safety has revealed a steady rise for modal share, but blames the weather for putting a dampener on Scot’s desire to cycle. 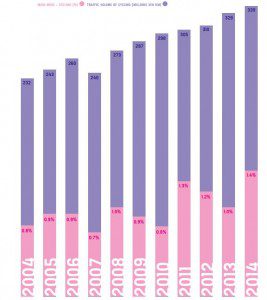
The local Government’s Cycling Action Plan committed Cycling Scotland to an annual report on indicators of cycling participation. In the 2016 document, it has been revealed that modal share is highest in Dundee and Edinburgh at 4.2% of journeys, with a national average of 1.4% in 2014. Sounds about right for the UK? Well that figure was just 1% in 2013, so growth has been forthcoming in recent times.
Cycling as a percentage of total traffic volume was 0.54% in 2004 and 0.76% in 2014.
Cycling to school levels in 2014 indicated that 5% of kids are taking to two wheels for their journey in primary, but as is the case in England, that figure drops substantially by secondary school, with just 0.9% participation.
When it comes to commuter cycling, 6% are said to regularly take to bicycles for their journey. Edinburgh, Argyll and Brute, Moray, Highland and Dumfries and Galloway have the five highest shares. The wards with the highest level of cycling to work include: Meadows/Morningside [9.9%], Southside/Newington [9.3%] and Fountainbridge/Craiglockhart [6.9%].
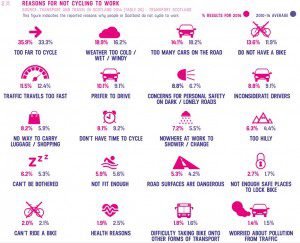
While growth has begun to accelerate, the five reasons given for not cycling more often are in some cases perhaps justified, but largely typical. 35.9% blamed distance – the most common reason. Next up is the typically soggy climate at 18.9%. Motor traffic – a somewhat ironic excuse if the person the takes to a private vehicle – accounts for 14.1%.
Sticking with the reasoning for not cycling, 62.7% of journeys in Scotland are sub 5km. That figure varies wildly with the topography, however. In Renfrewshire just 45% of journeys are sub 5km.
When it comes to infrastructure, Scotland is gradually gaining extra kilometres for cycling, but in some crucial urban areas the stats have gone in the wrong direction. As a result of sections of the National Cycle Network being redesignated, urban spaces actually lost 28.4 kilometres of infrastructure between 2013 and 2014.
There is a net gain, however, to the tune of 376 kilometres, largely delivered in rural open road paths and attributed to a route through the Western Isles becoming NCN classified in 2013.
Between April 2011 and April 2015 31km of NCN community links were added and a further 89km non NCN classified. Overall NCN growth saw 412 extra kilometres developed in the four year period. A further 155km was upgraded or resurfaced by Sustrans and its partners.
Incidentally, BikeBiz reports that the Take Care of your Trails movement is calling on volunteers to help shape off-road trails this weekend (and prizes for help are on offer).
As seen below, figures from the Sterling cycle hire scheme point to growth (though this could again be weather influenced)

In its “areas for development” conclusion, the document first of all reminds us that Scotland’s Cycling Action Plan has a vision for 10% of journeys made by bike by 2020.
Furthermore, it calls for the creation of a key set of indicators on behaviour, infrastructure and other trends. Gathering that information, it says, is key to policy development. Additionally, a co-ordination of gathered data is asked for from a range of sources, including automatic counters and surveys.
You can read the full report, which includes breakdown by district, in all its infographic glory here.
This article will now join our series on cities where investment in cycling has paid off, which you can read in full here.