Market study: Bikefitting’s key demographics, service charges and profit potential
In a trade media exclusive, pro tour bike fitter and Custom4.Us CEO and CyclingIndustry.News columnist Jon Iriberri shares a sample of his research into the world of professional bike fitting. A special thanks is extended to the International Bike Fitting Institute and Pioneer’s representative Andy Brooke.
I’d like to thank the fitters for taking part in this project; the data collected will be analysed and used to teach, orient and develop our young professionals. We organised a questionnaire limited to worldwide Bikefitters and received around 200 answers from 38 nations.
We would like to underline the global vision of the data exposed and collected. It is necessary to recognise the importance of English speaking countries in our specialty. Bikefitters from the USA, England and Australia represented nearly 60% of those answers, countries which largely represent the geographical expansion of our business.
The results are an accurate representation of worldwide bikefitting services and trends. We very much hope the data will help us deepen the knowledge of our business.
The Bikefitters as professionals
The profile of Bikefitters is most often a middle age man (around 45 years of age), with some general educational degrees (Bachelors/Degrees/College) and in some cases Post Graduate, High Degrees and even PhDs. Most of the bikefitters are full-time professionals and self-employed.
The service of Bike fitting
The average price on the Bike fitter’s services is around $200, with a price range from $100 to $300. We must take into account that there is a large difference depending on the geographic area. We could conclude that the area and economical region determines the price of the studio.
The average bike fitting session length is slightly longer than 2 hours. There are also sessions of more than 4 hours or less than one, but they are less common.
Knowledge and Technology
The fitters spend around $1,000 per year on training. There is a huge difference from those who do not expend anything and those ones who spend more than $2,000.
For those who invest well they highly value the knowledge acquired and put it into practice. Bikefitters spend an average of four days training per year with, again, big differences between those who do not do anything and those who do more than 10 days.
A similar trend occurs with technology investment. $6,000 is the average spend, but there is a huge difference (double) between fitters who do or do not invest. Bikefitters therefore, in general, invest much more in tech than in knowledge, which opens the door for an interesting reflection.
The average fitter carries out around 250 fitting services per year. Again, there is a large difference between professionals who deliver less than 100, to some completing over 400. This provides very interesting information regarding the opportunities and the limits of our business compared to other professionals and also gives us some approximated budget, which could be used as an investment in technology and in training.
Customer profile 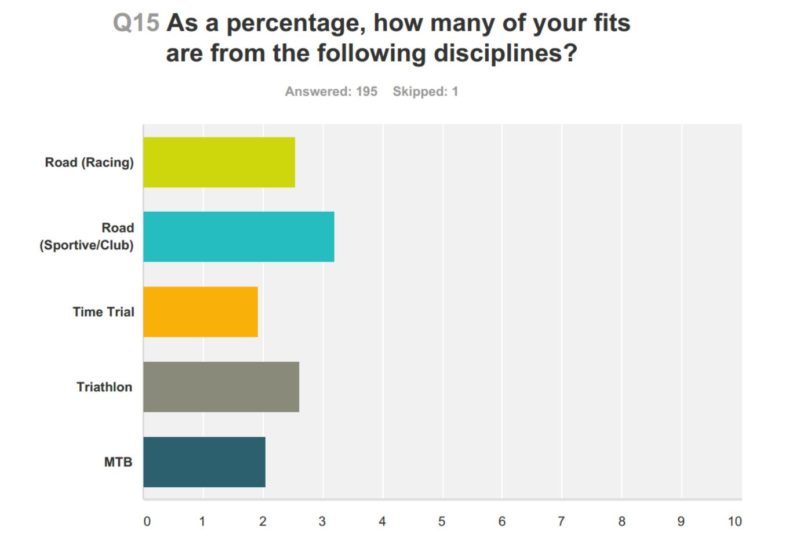
The average customer travels around an hour or less to receive a fitting and it is uncommon to drive over two hours. The typical customer is often competitive, semi-competitive or a recreational road rider. Less common, yet present, are triathletes, MTB riders and time trialists.
As I pointed out in the global research, back and knee pain are the most common injuries among customers. The primary cause of the problems is the saddle, followed by the shoes.
Customers go to bike fitters based on word of mouth over all the other communication combined at present, including advertisement, referrals or shops. This must be underlined in order to invest wisely in those areas that will help us to get the attention of the wider public. 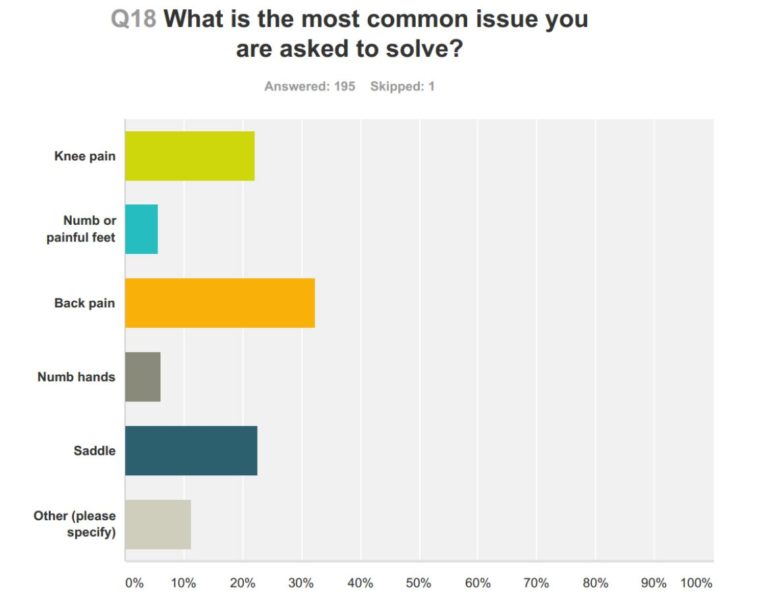
Regarding the follow up post fit, the most common method is to send an email to the customer. Other methods include a mix of phone calls, re-appointments, or no action at all.
The most common additional material sold around the fittings are saddles, insoles and shoes, in this order. Most commonly, complementary services include workshop tasks and training services. Physiological testing, custom/regular bikes and custom insoles are less offered.
Video image capture in 2 and 3D is the most used bike fitting technology, far ahead of pedaling analysis and pressure mapping. Anecdotally, 10% of the respondents are not using technology.
Related: Where does the industry stand with bike fitting gone bad claims?