50% increase in cycle superhighway use since protection added, shows TfL data
Transport for London data outlining progress made toward a goal of 1.5 million cycle journeys per day by 2026 today reveals a 50% rise in Cycle Superhighway usage since the four new CS routes added protection.
Adding weight to the theory of build it and they will come, some 90% of cyclists venturing onto London’s streets are now said to be choosing protected cycleways over the roads. 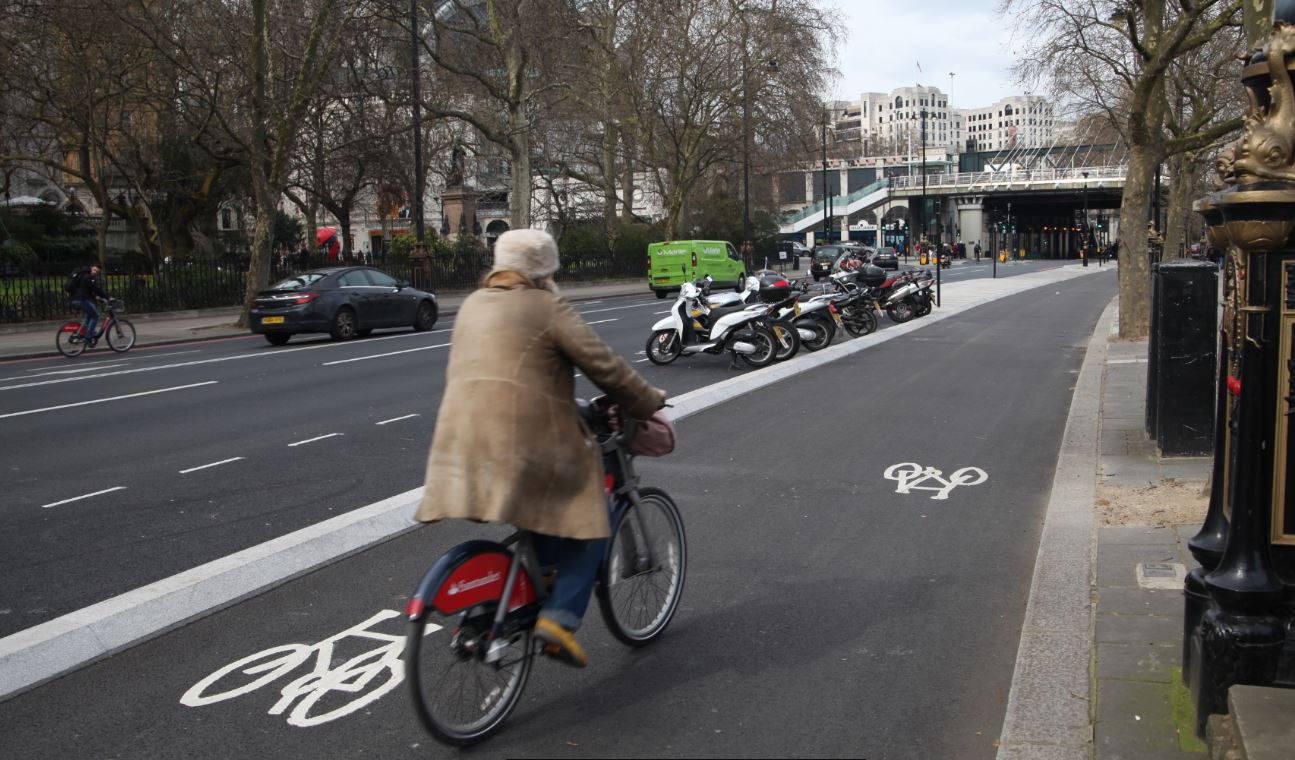
Some 4,695 cyclists now use the North-South corridor during the morning rush, which calculated by former Cycling and Walking Commissioner to be 26 cyclists per minute passing. On the East-West route 3608 use the route, or around 20 per minute.
At present a new Cycling and Walking Commissioner has yet to be recruited, a role that CyclingIndustry.News previously learned was estimated to be filled by the start of November.
Blackfriars Bridge, a segment on which cyclist numbers outstrip motor vehicles during peak time, has benefited hugely from segregation from motor traffic.
In only five months since the launch of four new routes, there has been more than a 50 per cent increase in the number of cyclists using the East-West (CSEW) and North-South (CSNS) Cycle Superhighways compared to pre-construction levels, taking the total number of cyclists to 8,400 using Blackfriars Bridge and 7,000 using Victoria Embankment each day in the morning and evening peaks. The majority of cyclists are now choosing to use the dedicated cycle track rather than the carriageway, with over 90 per cent doing so along these routes.
A key headline delivered in 2014 was the claim that cyclist’s journeys equated to one fifth of tube journeys at 645,000 daily journeys. TfL said on their ambitions to further build on these figures, offering: “By 2031, London’s population is expected to increase by approximately 1.3 million and the city will host an additional 800,000 jobs. With increases in population, more people are needed to cycle to help reduce overcrowding on London’s roads and public transport networks.”
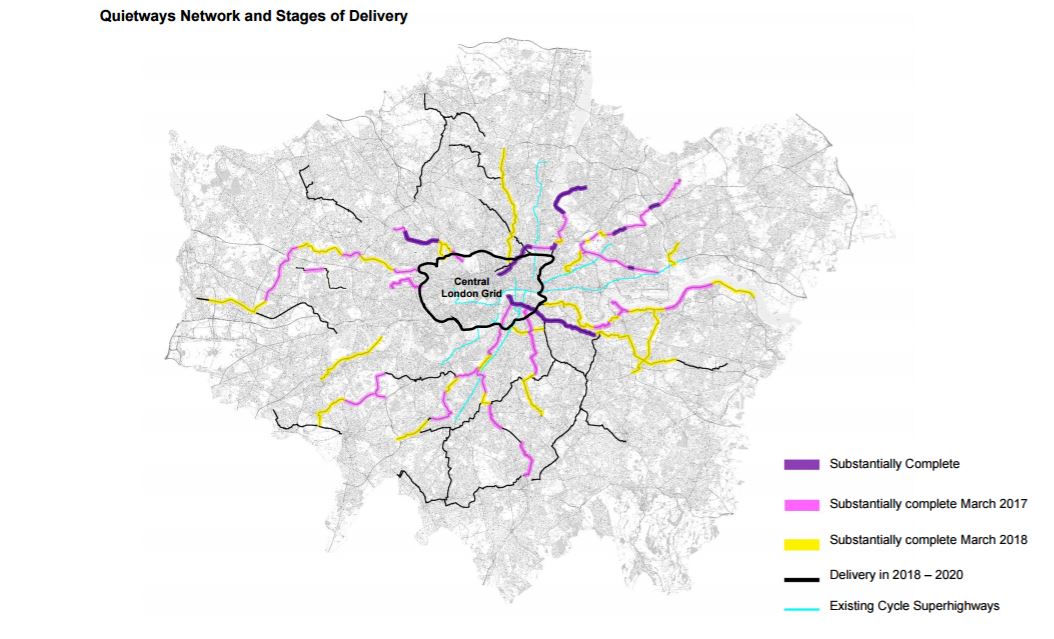
Quietways
TfL admit that the delivery of Quietways has been slower than anticipated, meaning that Q1 is the only segment to register any real progress.
On Quietway 1 certain sections saw an increase from 650 to 900 cyclists in the morning peak, a 38 per cent increase.
On the delays to the wider rollout of the Quietways, TfL offers: “The original programme was set to match a very ambitious desire to deliver, but this did not take into account the complexity of the programme, or the ability of the boroughs to expand delivery capacity from a “standing start”. Borough capacity to expand the delivery on this unprecedented scale was untested, and would prove to take some time. TfL’s provision of additional support through a contract with Sustrans has undoubtedly assisted with early stages of design and community engagement. However, the proposals have still required the usual due process of local political decision making (which often differs from authority to authority) and detailed consideration of public feedback.
“Projects which have impacted on vehicle access, or on parking arrangements – as is relatively common with QW projects – have proved to be controversial locally, requiring time to consider carefully all objections and change designs where necessary.”
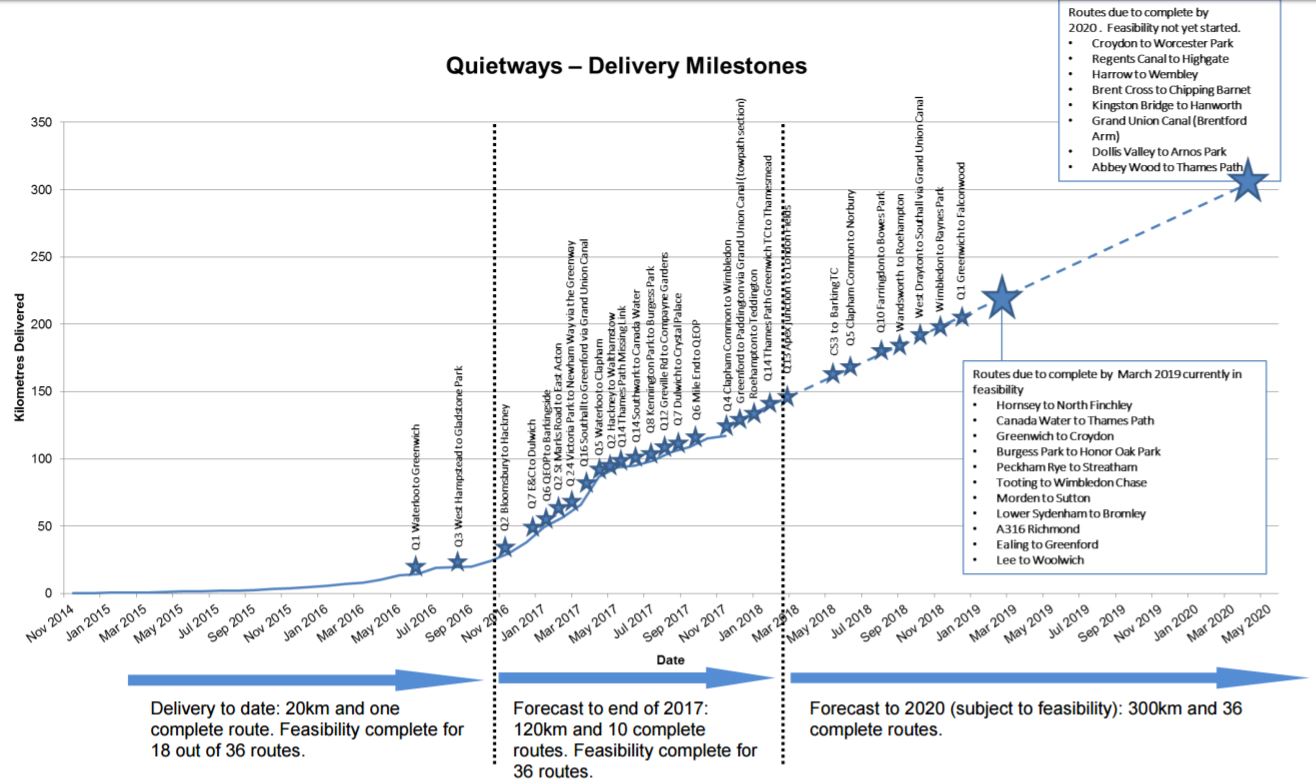
The final cost of the Quietway programme is estimated in the region of £116.7m, plus a further £1.9m for wayfinding. This incorporates a £5.5m reduction in estimated final cost following review as part of the recent Comprehensive Spending Review. TfL state that there is no fundamental reduction in the intended programme, so the challenge going forwards will be to work with boroughs and other partners to deliver the same outcomes, but reducing the cost through “value engineering” and an increased focus on value for money.
Seven routes with a total length in excess of 50km are due for completion by Spring 2017. The wider network (subject to successful completion of feasibility studies on all routes) is to measure over 300km in length.
You can dig into TfL’s data here.