Department for Transport report: Cycling’s modal share continues nationwide slide
Today marks the release of the Department for Transports 2016 report, which details in depth how the population moves from A to B, emissions, logistics and much more.
We’ve spent the morning sifting through the data trying to better understand how active travel fits into the mix. The conclusion, cycling levels remain stagnant across England and lack of financial support for active travel against eye-watering sums for motoring and rail remains to blame.
The standout points from the DfT’s report are:
Cycling’s Modal share in England
- Despite there being a huge economic case for driving participation, cycling continues to have rock bottom modal share of just 2% of trips in the UK, covering 1% of the distance. The ECF recently valued cycling’s overall economic contribution at over €1,000 per head in the EU’s 28 member states.

- 15% of adults in England cycled at least once a month in 2014 to 2015, rising to 17% in the East of England, South West and South East.
- Head to Cambridge and that figure leaps to 58% of adults, the highest rate in England. In London, despite growing its modal share, under 15% of adults cycle once a month.
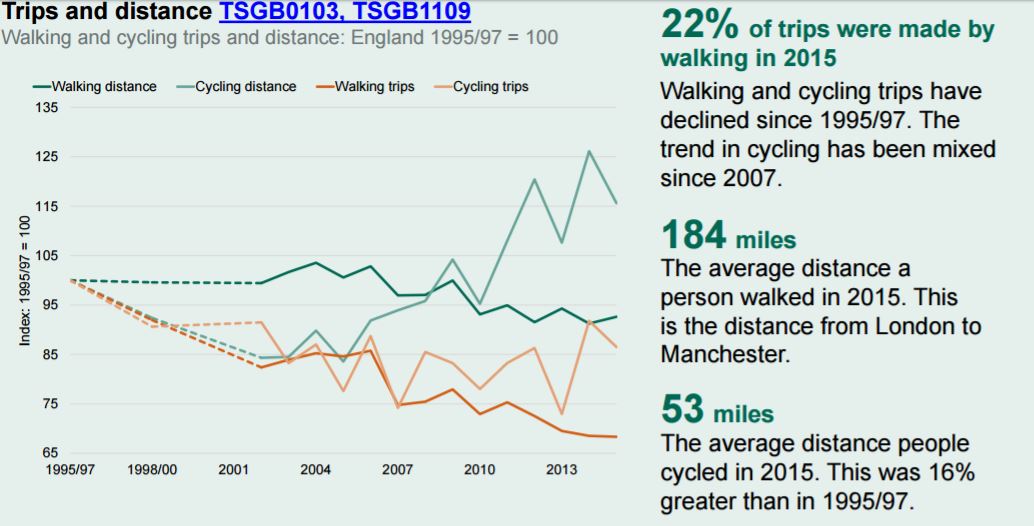
- The average distance cycled annually rose by 16% on 1995/97 figures, with 53 miles recorded annually.
- Cycling trips however show a nationwide trend of decline in the past few years. This will vary heavily from region to region. London’s modal share in particular is surging on the back of investment in safe infrastructure.
Cycle to School
- When it comes to cycling to school, 1% of trips are cycled by 5 to 10 year-olds and 2% among 11 to 16 year-olds. This trend tends to reverse again later in teenage years.
Bicycle ownership
- Bicycle ownership levels, which have been subject to the attention of the Bicycle Association of late, fluctuate wildly, with the five to ten year-old age bracket having highest access at around 85%. This dips below 75% for 11 to 16 year-olds, before declining drastically to under 50% for 17 to 20 year-olds.
- A slight bounce back occurs from 30 through to 50 year-olds, though from from age 60 onwards access to a bicycle declines to just over 20%.
Killed and seriously injured 
- Fatality figures still showed vulnerable road users to be bearing the brunt, with walking and cycling recording 26 and 24 deaths per billion kilometres traveled. Motorcycle riders recorded a frightening 83 deaths per billion.
- Those killed on bikes has however declined slightly, with 2015 numbers placing cyclist deaths at 6% of all recorded down 12% on 2014’s grim tally.
- In total there were 3,339 cycling killed or seriously injured records in 2015, a 5% fall on 2014’s figure. The number killed nationwide has remained between 100 and 118 since 2008.
Emissions
- 23% of greenhouse gases stem from transport, a figure up 15% on 1990. 93% of those emissions come via from the roads.
Expenditure
- Rail saw a whopping 52% of the public expenditure between 2015 and 2016, while Local roads (19%) and national roads (13%) made up the bulk of other spending. Spend on cycling isn’t specifically mentioned. Cycling UK’s latest analysis suggests that spending on cycling in England amounts to just 72p per head of the population, which against a total spend of £29.2 billion, wouldn’t be likely to show up on the pie chart. You can see how cycle spend stacks up against other transport projects here.
- On average, 14.1% of household expenditure went on motoring costs and transport fares.
To view the Department for Transport’s Walking and Cycling data specifically, click here.


