UK Cycling finally showing green shoots of growth, shows latest DfT data
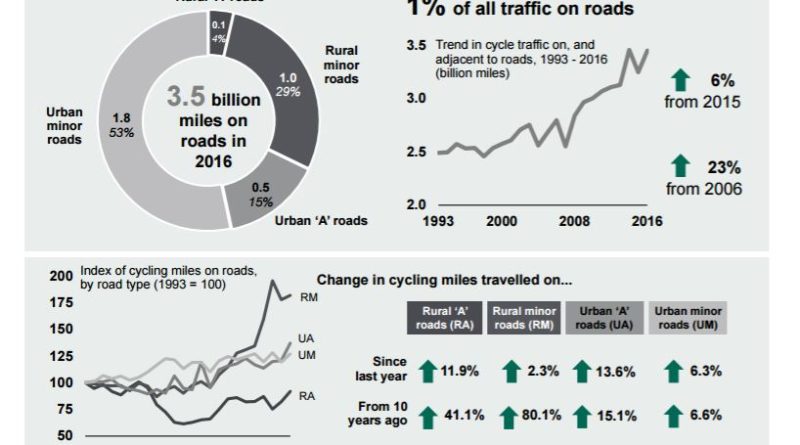
Cycling in the UK is showing slow signs of growth, rising 6.3% in mileage terms on 2015 levels, according to Department of Transport data released today.
Coming from an admittedly low base, cycling topped the pile in percentage terms for modes of transport increasing their annual mileage. Compared with data from 20 years ago cycling is up by more than a third at present levels. Light commercial vehicles, the second biggest grower, added 4.7%.
That low base is however painting the figures in a generous light, just 1% of all roads traffic is accounted for by cyclists. That figure is, however, up 23% up on 2006 levels.
Growth in use of both rural and urban A roads have seen the greatest usage surges, delivering 11.9% and 13.6% year-on-year growth, respectively. Indicating a strengthened leisure and performance cycling charge, the largest 10 year growth stems from an 80.1% rural minor road increase.
Tellingly, the DfT report says that “in general, cycling activity is quite unevenly distributed within the population, with 65% of people rarely or never cycling, but almost half of those cycling doing so more than once per week.”
Previous data suggested that where safe cycling infrastructure exists, more people will cycle.
Between 2015 and 2016, cycle traffic rose on all road types to reach 3.5 billion vehicle miles; a similar level to 2014, which was the highest figure since 1987. Although over four-fifths of the road cycle miles ridden in 2016 were on minor roads, the largest proportional increases in cycle traffic were on ‘A’ roads.
The DfT report adds: “Year-to-year changes in cycle traffic can be volatile due to factors such as the weather, so long-term changes are more reliable indicators of underlying trends.
NTS figures on cycling frequency (below), which show that the proportion of people cycling at least once per week stayed roughly constant between 2003 and 2015, rising just one percentage point from 14% to 15%.

“Despite the recent growth in cycle traffic, cyclists in 2016 traveled only around one quarter of the 14.7 billion miles ridden in 1949. Cycle traffic fell most quickly during the 1950s and 1960s, coinciding with a large rise in car ownership. The lowest annual cycle mileage on Great Britain’s roads was seen in 1973, at 2.3 billion miles.”
On road deaths cycling’s tally is still disproportionately high with some 3,339 people featuring in the killed or seriously injured data for 2015.
Air quality
Road transport accounted for 22% of the UK’s CO2 emissions in 2015.
CO2 emissions from road transport fell by 6.3% between 2000 and 2014, despite a 7.6% rise in vehicle miles travelled over the same period. Fuel efficiency has been improving, and sales of ultralow emissions vehicles have risen rapidly in recent years. The number newly registered ultra-low emissions vehicles in 2016 was 41,819 compared to 4,313 in 2013, reducing the impact of each additional mile driven.


