Analysis: Can algorithms predict the bike world’s discounting trends?
In the first in a series of pieces of analysis for CyclingIndustry.News, data scientist Andrew Isenman explores the impact of Brexit and the COVID pandemic through the lens of data., presenting the case that 2020 was a year where discounting came under control in the face of new challenges.
Online price data, including RRP, sale price, brand and date of sale can give a real insight into the question: Are the online retailers continuing to discount through this current period of change and, if so, is it to a greater or lesser extent?
In 2018 I started collecting publicly available data from four of the biggest online cycling stores. Each day the data was processed and stored until the point where the dataset was big enough to not only look at historical trends but to allow for the forecasting of the future.
Data processing and analysis is big business in 2021, the tools and techniques previously only available to large organisations and academic settings are now available to data journalism. In this article we use a technique called time series analysis to plot the historic price trends over time whilst providing a forecast for the future. This method is particularly effective when the data you are analysing is affected by seasonal trends and can be viewed over successive seasons. The retailers have been anonymised in this study as the focus is on long term trends rather than individual retailer’s strategies.
Reading the charts
Before we start it is important that the charts are read correctly. The black dots represent price points over time. Seasonality is set to daily to give us the most granular view. The blue line represents the average discount offered with the y axis describing the level of discount. 1.0 indicates all products being sold for RRP with 0.9 representing stock being sold on average of 90% RRP and so on. The blue coloured area shows confidence. The smaller the blue shaded area the higher the confidence in the forecast.
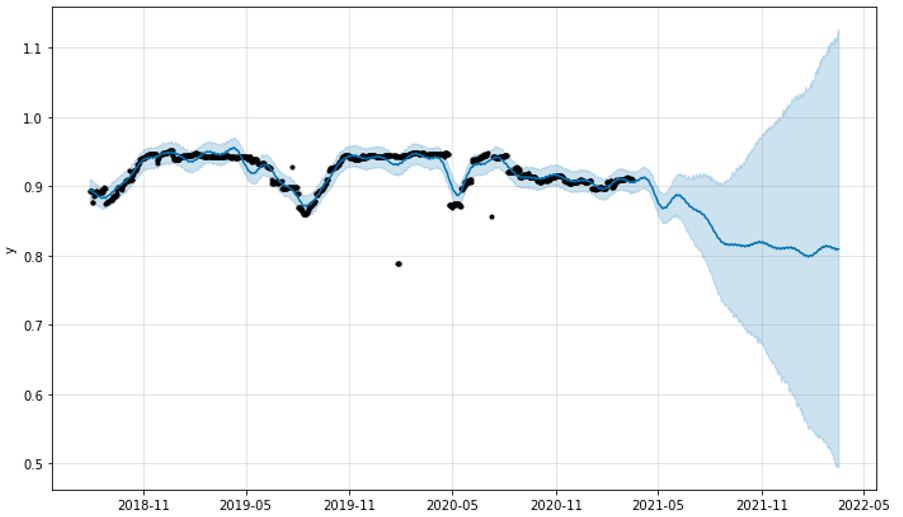
Retailer One.

Retailer One shows that products are typically discounted by approximately 5% throughout the season. Dips around June and July show sale periods where the retailer’s average sale price will drop just below 90% of RRP. In 2020 the summer sale was both shorter and discounts were not as great, maybe as a response to low stock availability across the industry and the retailer not needing to discount as much. From June 2020 the retailer has started to discount more and more and the forecast shows this will continue into 2021. Retailer one’s discounts have been historically less than the others in the study potentially indicating that there is a pressure to discount to be competitive.
Retailer Two.
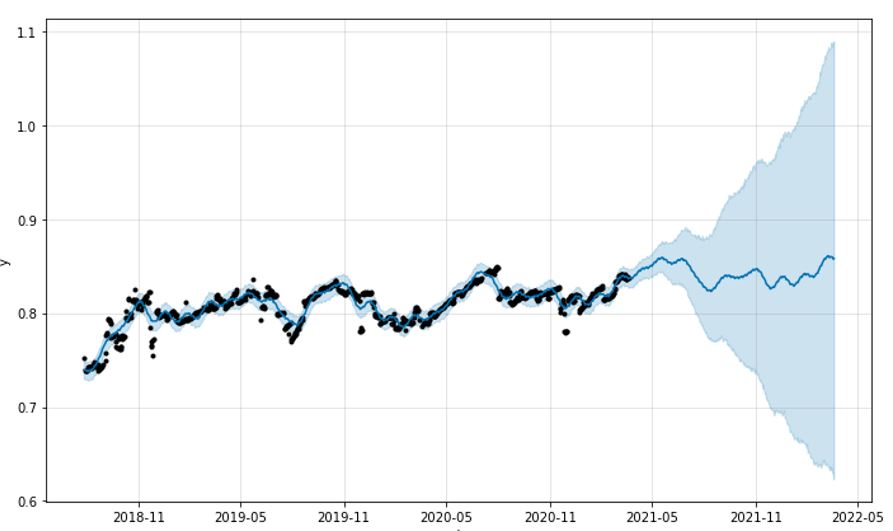
We apply the same algorithm to Retailer 2. Here we see two sale cycles. The summer sale and a smaller winter sale. With retailer two, a big sale was identified in July 2018 where products on average were 75% of the retail price. That climbed to around the 80% mark in late 2018 and has gradually risen over the remaining period. For this retailer discounting has slowly decreased over the time period and the model predicts this will continue. The interesting observation from this chart is the clusters of black dots just after November each year. This coincides with Black Friday and indicates that the retailer’s average sale price drops by about 5% at this time of year.
Retailer 3.
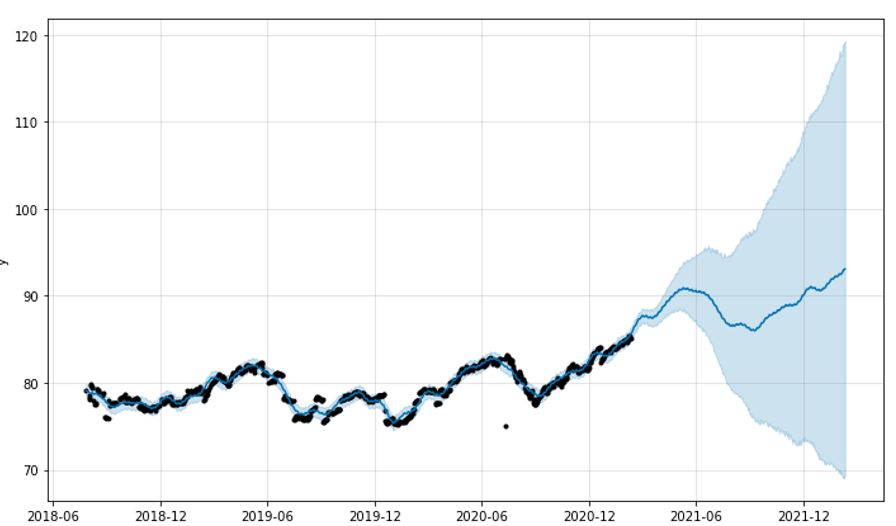
Retailer 3 does not appear to have a sale cycle but prices are close to RRP in both the summer of 2019 and 2020. This would indicate the retailer discounts less when demand is high. There is no indication that the retailer responds with discounts during events such as Black Friday maybe choosing to drive sales through marketing rather than real discounts to the customer. The forecast is that this retailer will continue to discount less in the coming years through the prediction shown for summer 2021.
Retailer 4.
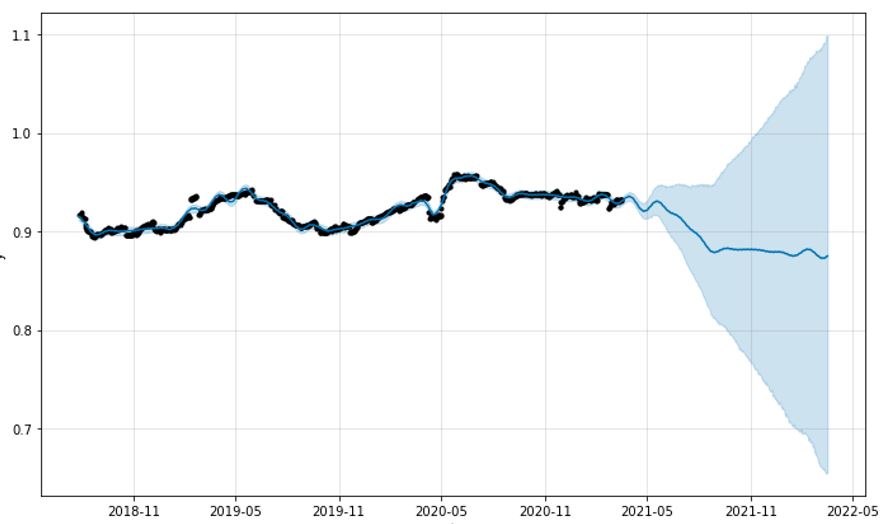
Retailer 4’s chart shows summer peaks and winter lows. In 2018 and 2019 prices dropped to an average 90% of RRP starting in September and lasting to March with highs of 93-95% of RRP in summer. Again the profile is slightly different in 2020 with no clear reduction in price through autumn and winter.
Conclusion
On inspection it would appear online discounting is driven at a retailer level rather than an overall trend in online sales. Only one of the retailers clearly showed true discounts to the customer on events such as Black Friday, which would indicate that online retailers use marketing techniques rather than discounts to drive sales through this period.
Two of the retailers now show a trend to higher discounting, whilst two of the retailers are trending towards offering lower discounts. All retailers showed some level of seasonality which indicated that generally prices were lower in winter. Overall discounts can be as high as 25% off RRP, but only for small time frames potentially due to clearing end of line stock. And to the question of Brexit and the Pandemic, it is impossible to see the individual effects of the two events due to their overlapping time, but what is evident is that 2020 was a year where the consumer benefitted less from discounting online.
Online shopping trends are changing. New ways to shop include augmented reality (as implemented recently by Velorution), increased voice searching and remote video consultations. Learn more about the trends here.