UK cycling levels flatline in latest DfT data
Data released from the Department for Transport this week covering the nation’s transport habits in 2018 has shown UK cycling levels remain flat.
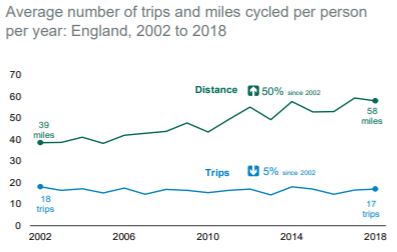
This year’s report mirrors several of those prior, with ‘since 2002’ used regularly within the document as a benchmark for progress. The graph linking then to now is, however, an almost flat line, staggering between 14 and 18 trips made per person, per year, since 2002 and landing at 17 trips averaged in 2018.

Looking at more recent history, the number of trips made is actually steadily declining; with trips made down 5% on 2012. Adults cycling ‘at least once a week’ fell from 12% to 11% between 2015 and 2017.
Distance covered is a more positive note, with 58 miles cycled on average per person. This is marginally down on last year and about the same levels as in 2014, but is around 50% up on levels in 2002.
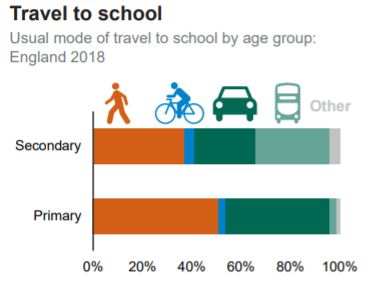
With the Government currently only funding half of UK children’s BikeAbility training, cycling to school levels remained flat at 3%. The figure has fluctuated between 2% and 3% since 2002.
Chris Heaton-Harris, the Conservatives’ cycling and walking minister recently said at Brompton’s hustings on Active Travel “we will roll BikeAbility out across the country,” a point which was later followed in the manifesto by a pledge to “double” BikeAbility training – aka, train every child in the UK.
The maths will be questioned, however. The funding pledge attached at just £70 million per year for the five year term is just £1.18 a head, less than the already low spend (by European standards) on active travel provision.
Further into the data it is revealed that nearly all local authorities have less than 20% of their adult population cycling at least once a week. 15 authorities, including the likes of Oxford and Cambridge – where infrastructure and traffic calming measures are generally better than average – boast higher levels.

Cambridge led the nation once again. The University city saw 57% of adults cycle at least once per week, followed by 39% in Oxford and 35% on the Isles of Scilly. Havering, at just 3%, had the lowest cycle usage.
In the instance of road casualties, cyclists were involved in 99 deaths on the road in 2018, a figure that has again been relatively static for a decade. 4,205 KSIs (killed or seriously injured) occurred in total, 14% of all incidents.
Expenditure is still largely skewed on the roads towards the motorist, with the 2018 spend tally reaching £10.2 billion.
By the latest budgetary pledge for cycling just 0.24% will be spent on cycling provision. The budget, based on a £1.45 million per kilometre calculation, is roughly enough to lay a single top-level cycle path from London to Chesterfield.


