
How city planners are using Strava Metro to redesign around green transport
Said to be the most data rich tool of its kind on the planet, Strava has put its services to good use in the form of the Metro platform; a city planner’s dream. Tom Knights and Gareth Nettleton explain how the firm’s digital tooling is now having a meaningful impact on the streets…
Have you ever wondered how Google Maps knows there’s a traffic jam? Neither had we until February this year when Berlin artist Simon Weckert made headlines by ‘hacking’ the traffic. What did he do? Quite simply he carted a trailer load of 99 GPS enabled mobile phones along a road, tricking the system into thinking 99 people were on the road in a small space. Voilà, digital traffic jam.
What Weckert managed to replicate was a miniature and time-condensed version of what Strava has achieved, albeit for more productive ends. Famously hard to shift, many perceive the cycling and running social app as a sports only network, when in fact much of the firm’s more productive work has come via its Metro arm. This is accessible when logging rides in the app and is there simply to offer the user the chance to detail their commute or non KOM-hunting ride with view to showing authorities ‘Hey, people cycle for transport too, look’.
“Obviously the core of Strava community does focus on leisure and athletic pursuits, but 67 million users won’t all be dressed in lycra, as the stereotype goes. Active travel journeys have been mapped a lot more since 2017 and users are now much more aware of Metro and its purpose. Any publicly recorded activity can be added to the Metro map, so there’s an authenticity to data that’s genuinely crowdsourced. When it comes to tagging, we also use premise that any A to B journey that isn’t within 1km would count as an active travel journey,” says Tom Knights, Partnerships Manager at Strava.
For the UK in particular the data is especially impressive. 9 Million downloads of the app equates to nearly 14% of the population having used the app in some form. “The amount of inbound activities is unparalleled,” we’re told, though the message could be stronger still. “We talk about it pretty consistently, so our users are aware. Whenever we talk to the press they’re fascinated. A goal of ours to make the average member more aware of how this can work so it’s not an overlooked sideline functionality.”
It’s eye opening to hear Knights namedrop, completely by chance, the county council local to Cycling- Industry.News head office. Metro data has found its way out of cities and is even drilled down upon by local authorities who may appear to be doing very little on the surface, but are sitting patiently, using Strava’s dashboard to make a decision where to strike. The idea is that, with hard evidence of actual cycle use, paired with new national design standards, councils can’t possibly get infrastructure provision wrong. What’s more, the data is even able to reveal the times of day when traffic peaks. From a planner’s point of view this is helpful, says Gareth Nettleton Strava’s VP or marketing.
“The differences are so clear. There’s often big spikes Monday to Friday at rush hour, while weekend rides are spread out and more leisurely. Councils can see popular arteries in and out of the centre heat mapped and as such can make decisions on measures such as traffic calming at peak times. The biggest thing people notice is that, where there’s protected bike lanes, you can see sharp diversion to use those routes. People will pay a distance tax outside of the straight line for a better quality of ride. Where you have protected lanes you get a healthier demographic balance of male and female. At Embankment in London, for example, you see a good balance of journey and route choice. Routes like these become low pollution corridors.”
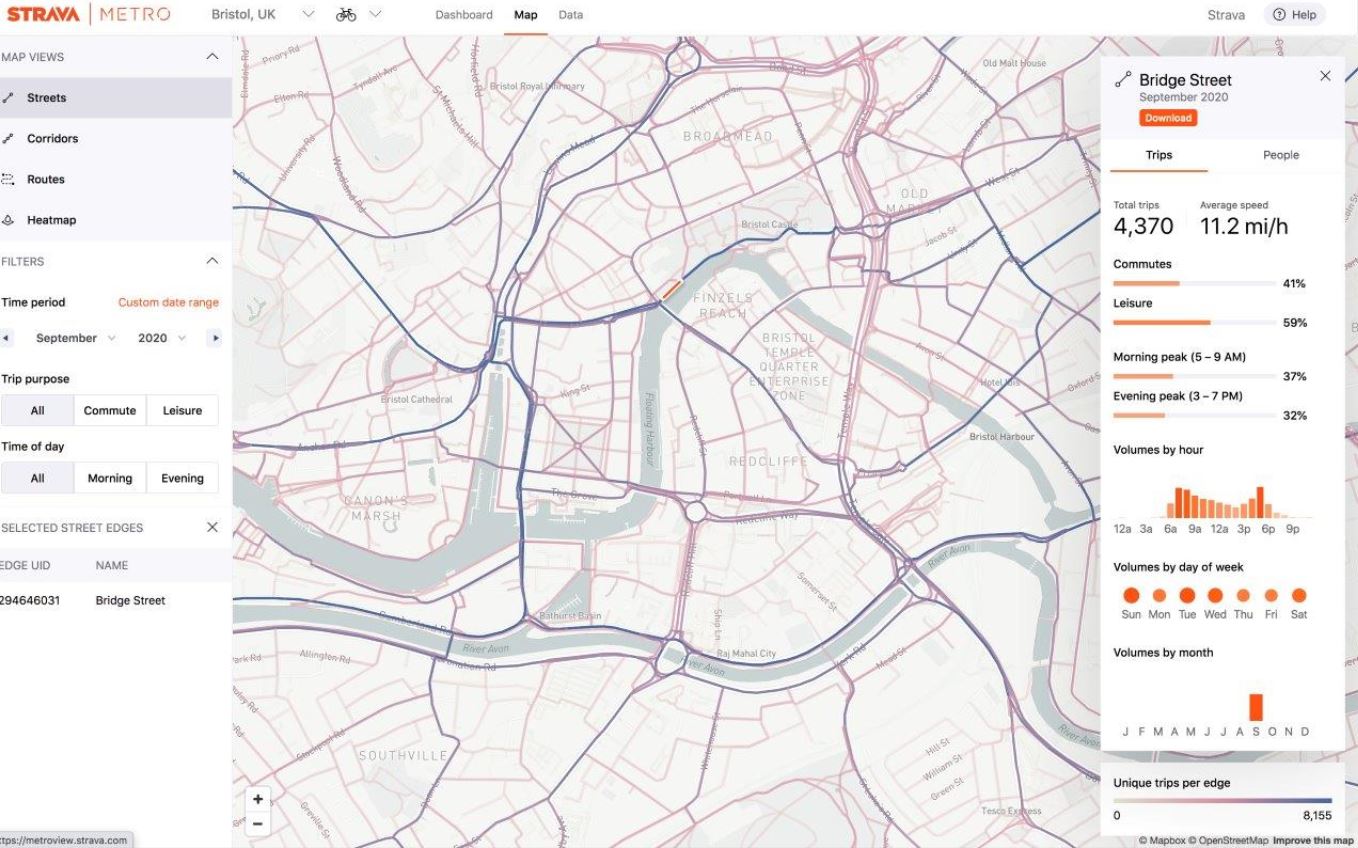 On the user-friendly dashboard it’s possible to add and remove layers of data to better understand trends. Like-for-like comparisons can be made over periods of time, illustrating progress or pinning down other macro factors that may boost or reduce cycling levels. Average speeds can be logged, telling planners how people are interacting with the landscape and whether it’s running efficiently.
Transport for London has been a Strava Metro client for four years and for a large chunk of the early days the Metro dashboard was used as a validation tool, proving that people do use infrastructure when it is laid down. Demand can literally be demonstrated to have been induced with safe lanes. More recently up to Covid-19’s advance they were assessing the success of the Quietways programme, asking which roads should be considered for the Quietway treatment.
“Any local authority can begin getting insight on the same level inside a month,” says Knights.
At a time when there is top down encouragement to get moving on shaping a green recovery by politicians, the tools have never been more useful, nor sharper. As has been well documented, Covid-19 led to a spike in cycling from those who perhaps didn’t cycle regularly, something that reflected on Strava’s Dashboards.
Nettleton says: “What’s blown my mind is just how strong 2020 has been for cycling, we can see that in the data. We all thought we’d see an increase, but the volume in UK nationwide is up 162% off a high base of active users. Individual cities such as Liverpool and Manchester come out top. London too. What’s interesting is the correlation between the return of road traffic and the reduction of cycle journeys. It’s a shame, but many people seemed to only feel comfortable cycling on quieter roads. May and June saw the peaks.”
Armed with this information Strava has now sought to assist the grassroots bike industry campaign BikeIsBest with its Metro data. The heart is in the right place with this collaboration, says Nettleton.
“We have a responsibility to our members to make their rides easier and safer, so getting data into progressive hands such as the BikeisBest campaign is key. We became involved to try to open people’s eyes to behaviour change. We want to work with bike industry to grow cycling naturally.”
With over four billion activities now pinned to Strava’s maps the evolution from spreadsheet to interactive data analysis tool is now complete. For those wishing to plan around an active travel future you can get in touch simply by visiting www.metro.strava.com, what’s more, the data is now accessible free.