
Cycling Advocacy Resource: Data to build a case for cycling in your area
A bicycle business news site dipping into cycling advocacy – what’s that about, you ask? The industry has been called upon to turn advocate by numerous prominent stalwarts, so here’s our effort – a resource for active travel advocates to freely use in order to win over their local authority when it comes to providing safe cycling and more livable spaces.
And of course, at the time of writing, cycling for transport also presents the trade with its greatest scope for product development and, crucially, sales worldwide. The link between the creation of safe cycling infrastructure and increase in uptake is conclusive, so we tend to agree that everyone in the industry should take an interest in campaigning.
We will update this article periodically and further welcome your suggestions for links we may have missed. You can drop those on our Facebook wall here or via our Twitter here.
Return on investment
Key Fact: In Helsinki this report detailed a near eight fold return on investment on cycle infrastructure in the city, the highest return on investment among all transport forms. Each kilometre cycled is worth 1.22 Danish Kroner in Denmark, while motoring is costing around 0.69 Kroner per kilometre.
Links:
- Return on investment can be as high as 35:1, though averages between 5:1 and 19:1. That firmly makes it the best transport investment you can make, says this Department for Transport study.
- A Transport for London paper on the subject has the figure at 13:1, but with lots of extra perks.
- The European Cyclists Federation value cycling’s overall economic contribution at €1,000 a head across the 28 member states.
- Sport participation worth £44.75 billion in social return, says Sheffield Hallam Uni.
- Jobs related to cycling: Bicycle manufacturing creates 3 times more jobs that of car maker
- Sydney, Australia conducted a study that found that in adding 200 kilometres of cycling infrastructure to the city would yield a return of $500 million, or $3.88, for every dollar spent in wider benefits.
- House prices rise when in close proximity to low traffic volumes, as well as walkable and cycle-friendly infrastructure.
- Though it’s looking increasingly unlikely, if the Get Britain Cycling report’s recommendations were taken on board, CyclingUK estimates the economy could benefit to the tune of £248bn on the back of the knock on effects of increased cycling modal share.
- The benefits per person, per year if the Get Britain Cycling Report were adopted would amount to around £33 a head between 2015 and 2025.
- A report stemming from the NZ Transport Agency, is dedicated entirely to the economic case for investment in cycling.
- The UK’s cycle to work scheme has a 2:1 return on investment and that’s a conservative estimate…
- London boroughs with new cycle route access rise in Department for Transport modal share figures.
- Investment in bike lanes and bike share schemes shown to swell cyclist numbers
- Success of bike share can often hinge on safe cycling infrastructure
- Cycle tourism on the roads alone is said to be worth £106 million a year in economic benefit to Scotland
- U.S. Distributor QBP decreased health care costs by 4.4% in the first two years of offering cycling to work incentives, saving the business $200,000.
- Sustrans’ Bike Life study shows return on investment
- If you’re counting on the value of life, safe cycling infrastructure pays dividends says this U.S. study. Cycling Infrastructure reduces fatalities and speeds all round.
Retail trade and cycle lanes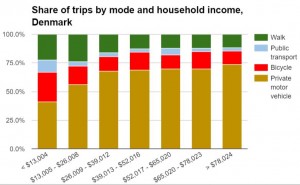
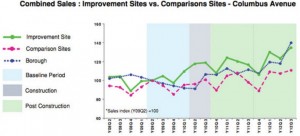
Key fact: On 8th and 9th Avenue, the USA’s first attempt at a protected bicycle lane, the infrastructure’s arrival correlated with an average 49% increase in turnover against a 3% rise in the same period borough wide.
Links:
- Manhattan’s Measuring the Street report
- Business case for converting street parking into bike lanes
- Cycling is essential for low income areas
- Cyclists spend roughly the same as motorists, but arrive more often
- The economic effect of liveable streets – NYC DOT (shown right) Full report here.
- The European Cyclists Federation value cycling’s overall economic contribution at €1,000 a head across the 28 member states.
Helmet Compulsion
Key facts: Australia saw falls in cycle use, on average, of more than 30% and Canada 28% to 40% following compulsion laws. The effects have been as radical as 90% decline, as reported in one all girl’s school in Sydney.
Links:
- Helmet compulsion in Australia and the negative effect on numbers cycling. The compulsion law came in during 1991 and numbers immediately dipped.
- Motorists more at risk of head injury than cyclists, says study.
- Senate told to remove mandatory helmet laws as they’re harming cycling.
- Helmets are inherently not designed for impacts with motor vehicles.
- Nick Hussey, Guardian: “Why my cycling clothing company uses models without helmets.”
“Electric bikes are cheating”
You may have heard people question the electric bike’s place in the market. Purists are often heard to describe e-Bikes as cheating, missing the point that these bikes are not specifically targeted at the sporty cyclist. So are they cheating?
- One Norwegian study demonstrated that aboard pedal cycles users were utilising 58% of their lung capacity, while electric assistance on max output still recorded an average of 51% of lung capacity used
- A similar study in Colorado found notable improvements to 20 e-Bike user’s cardiovascular health, with improved aerobic capacity and blood sugar control noted in all cases.
Danger posed by cycling on the roads
Key facts: Research and statistics both suggest that the more people that cycle, the safer cycling becomes. This is in part due to increased awareness of vulnerable road users, but also because with numbers comes pressure on authorities to cater to the people’s needs. In the 2016 London Mayoral election, cycling was the fifth most tweeted topic at 9%. Make cycling an election issue and progress soon follows.
Links:
- Countries with segregated cycle paths have unsurprisingly low Killed or seriously injured rates – European Commission encourages city planners to design in safe movement of people.
- If just one in ten car journeys were replaced by a bike ride that would offer the NHS a £2.5 billion saving in health costs over ten years. Two in three journeys in the UK are less than five miles, a distance comfortably covered by a 25 minute cycle or less.
- The 2012 National Travel Survey showed that risk of injury from cycling in the UK is just once per 19,230 hours cycled – (though we suspect that improves with better infrastructure)
- DfT stats from 2014 reveal that you are less likely to be killed cycling a mile than you are walking the same distance.
- Reported road casualties as a whole surpassed 14,000 in 2012. Cycling made up 118 deaths in that tally, undoubtedly too many, but a minority of the incidents when compared to other forms of transport.
- Taking London as an example, CyclingUK research found the city saw a 91% increase in cycling since 2000 and a 33% fall in cycle casualties since 1994-98. This means that cycling in the city is 2.9 times safer than it was previously. Those numbers are only improving now the city has begun to shape itself for cycling.
- Per mile traveled, cycling is safer than the majority of other modes of transport.
- The negative impact of the close pass and why the law requires a mandatory passing distance.
- Department for Transport figures 2014/15 on road KSIs.
- A third of London’s cyclists took to two wheels since safe infrastructure began to appear
- Safety in numbers theory proven in US cities
- Elderly would cycle in far greater numbers with traffic-free paths
- A survey of American citizens show they want to ride and that increased funding for active travel infrastructure is strongly desired.
Health Benefits 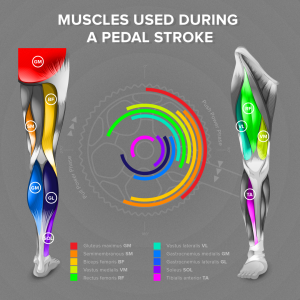
Key facts: Where to start with this one! An excellent start would be to log onto PeopleForBikes, who have pages on this subject.
82% of those who took up cycling as part of their commute believe they are now healthier.
In 2011 prices, a typical UK cycling city could be worth £377 million in savings to the NHS in healthcare costs.
The ECF estimates healthcare savings tied to cycling to be worth €191.27 billion a year.
To name a few positives, cycling offers:
- increased cardiovascular fitness
- increased muscle strength and flexibility
- Reduced risk of Type 2 Diabetes
- improved joint mobility (Image: WeLoveCycling: muscles used cycling)
- decreased stress levels
- strengthened bones
- decreased body fat levels
- prevention or management of disease
- reduced anxiety and depression.
Links: 
- In response to an epidemic in diabetes and other inactivity related illness, even the World Health Organisation says Governments should build active travel into our lives. Cycling has been proven to reduce such risks.
- Cycling for transport can cut risk of death from any cause by 41%, says study
- 30 reasons to take up cycling, from better sleep to increased brain function.
- Nothing motivates quite like a success story. Read about five people who achieved drastic weight loss. Before and after pics drive home the point, build active travel into your life and the rewards are many fold – from money saved on fuel to reducing your chances of heart disease, to name just a few.
- Research by the University College of London shows that cycling is five times safer than driving for those aged 17 to 20 years of age.
- The enormous pollution cut and economic potential of infrastructure supported bike share schemes
- The United Nations Environment has called for 20% of transport budgets to go to active travel to begin to reverse climate and health damage to motor-dependent nations.
- 30 million could be removed from Australia’s obesity-specific health bill with an increase of just 10 cents per litre.
- 11 health and social benefits of cycling.
- As a solution to cleaning up the air the Transport Research Laboratory recommends a modal share shift and electric bike adoption
- You’ll arrive at work less stressed and be more productive
- The World Helath Organisation’s global action plan recommends active travel as a priority to address the physical inactivity epidemic.
Pollution: is it safe to cycle and how does poor air effect us?
Key facts: This Cambridge University study shows the benefits of cycling outweigh the negative health impact of active travel in polluted cities, at least until you’ve cycled 90 minutes in 100 μg/m3 or more.
Links:
- Respro CEO: “City pollution is undoubtedly worse than is reported”
- Air pollution linked to increase in mental health issues in children
- 7% more cycle path equals 2% less greenhouse gases, calculates study
- The enormous pollution cut and economic potential of infrastructure supported bike share schemes
Congestion
Key fact: Around the globe congestion is choking our cities and seeing annual pollution targets breached just days into the year. Costing over €100 billion annually, congestion sets European cities back to the equivalent of 1% of the entire EU GDP.
Links:
- Congestion costing cities over 1% of EU GDP, ECF study shows
- The combined cost of congestion in US, UK, France and Germany will hit $293.1 billion per year by 2030
- In New York the addition of bike lanes have actually sped up traffic and reduced pedestrian and cycling injuries.
- Sustrans’ Bike Life study found that people cycling in the seven cities take up to 111,564 cars off roads each day. If these cars were lined up, this would equate to a 333 mile tailback – a distance greater than from Cardiff to Newcastle.
Cycling can boost your local and regional tourism 
Key facts: Cycle tourism represents 10% of Germany’s entire tourism revenue.
Cycle tourists tend to spend on average 9% more than those arriving in cars.
Links:
- Investment in cycle tourism is being pushed around the world, because… well Germany’s example about sums it up, it’s potentially worth a lot to your economy both regionally and nationally. Check out the investments in the following cities:
- Cape Town
- Rome
- New Zealand
- Oslo and Norway
- Atlanta, US
- Cycle tourism on the roads alone is said to be worth £106 million a year in economic benefit to Scotland
There’s no data available, how will we know where and what to build?
Key Facts: Actually, there is, and almost by accident. Social cycling App Strava is one example of how your city can obtain measurable data and GPS accurate too. In 2015, Strava members used their mobile phones and GPS devices to upload more than 168 million activities, roughly 5.3 activities every single second. In dense urban areas, nearly half were commutes, something for which the app now allows you to flag for the purpose of Metro’s datasets.
Links:
- Strava Metro – how cycle usage data for your local area already exists and is obtainable.
- Data is one thing, knowledge on how to use it and safely is another. David Hembrow’s study tours are a great place to start when it comes to clever cycle infrastructure.
- Why keeping cycle and bus lanes separate makes sense
- NACTO data shows how US cities have made cycling investment work
- Try the Copenhagen method of crowd sourcing demand. 10,000 responses in ten days gave the city its next project
“Nobody rides to work around here, why build cycle lanes?”
Key facts: Build it and they will come, it’s proven. A Cambridge University study found that 85% of the cycling happening locally directly correlated with the provision of infrastructure. Public support for catering for cyclist’s needs is higher than ever.
Links:
- SFU study shows a direct correlation between cycling infrastructure and a rise in those switching to commuting to work by bike.
- A survey of American citizens show they want to ride and that increased funding for active travel is strongly desired.
- Free to use bike share trial prompts increased local usage and subsequent bike purchases.
- Build it, they will come and it’ll benefit your city economically, shows SFU study.
- Cycle hire spikes after the installation of cycle lanes in London
- London modal share rises through the ranks in Department for Transport stats following investment
- A third of London’s cyclists took to two wheels since safe infrastructure began to appear
- Build it and they will come, proves NACTO study of US cities.
- The over 60s would cycle much more if they deemed it safe to do so
- Success of bike share can often hinge on safe cycling infrastructure
- A study by bike share giant Ofo has revealed that it’s actually lack of safe cycling infrastructure stopping people taking up cycling
Is Cycling with headphones dangerous?
Key facts: This one’s up to the individual to make a call on, but a study by Ride On Magazine found that a motorist with their car’s windows up hears less in decibel terms than a cyclist with headphones turned up to a reasonable volume.
Links:
- Cyclists with headphones hear the same as motorists listening to nothing.
Livable environment 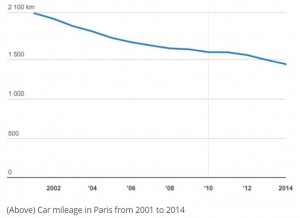
Key facts: Car use is, whether naturally or otherwise, largely declining in dense urban environments. In Paris car use is down 30% since 2001, while cycling’s modal share rose by eight percent between 2013 to 2014. The result when cars are banned, as evidenced by a 2015 day ban, offer a 40% drop in pollution in the city centre.
Links:
- How Amsterdam ditched motor dependency to became the bicycle capital of the world
- 71% of people support the addition of safe cycle paths on UK roads, says YouGov poll.
- The enormous pollution cut and economic potential of infrastructure supported bike share schemes
- A third of London’s cyclists took to two wheels since safe infrastructure began to appear.
- The United Nations Environment has called for 20% of transport budgets to go to active travel to begin to reverse climate and health damage to motor-dependent nations.
- As a solution to cleaning up the air the Transport Research Laboratory recommends a modal share shift and electric bike adoption
Should cyclists pay toward the roads? / It’ll cost too much to provide for cycling
Key facts: In the UK and often beyond, they do via council tax contribution, which at present funds the roads and has done since 1937. From 2017, the UK Government has announced a revision that will see funding from Vehicle Excise Duty go directly toward road upkeep, diluting the often-used argument against those who cycle on the roads about their contribution. However, electric vehicles are to pay £0 under the new rules, as non-polluting vehicles and bicycles do at present. Even under the new rules the treasury expects a funding gap between cost and income, so the gap will still be filled by local taxation revenue, as paid by all.
In the US, spending on the highways has exceeded revenue by $600 billion since 1947. The rest of that funding stems largely from bonds and the general fund.
All things considered, one mile of protected cycle lane is around 100 times cheaper than one mile of road designing for motoring. (See People for Bikes chart linked below)
Links:
- It costs the same to build parking for 75 bikes as it does for just 4 cars.
- People for Bikes hilarious cost per mile, per transport chart.
- How €2 billion in EU funding may be available for your town’s cycling project and how to access that cash.
- How does spend on cycling compare to other transport projects?
- $30 million could be removed from Australia’s obesity-specific health bill with an increase of just 10 cents per litre.
Cyclists run red lights, they should be banned
Key Fact: Sure, some do. In fact studies have shown roughly the same number of cyclists jump reds to motorists. But consider this, analysis in New York showed that motorists jump 1.23 million red lights PER DAY! If cyclists are jumping red lights, there’s a good chance it’s largely because the road layout flat out ignores the needs of vulnerable road users.
Links:
 In Paris the law has been altered in order to allow cyclists to pass through reds in certain
situations. Why? At right turns or to go straight at a T-Junction it was deemed safer to allow cyclists to move away from danger spots alongside HGVs.- In Denmark cyclists are legally allowed to pass reds on selected right turns. A two year trial demonstrated such a practice is perfectly safe.
- In London, approximately 4% of collisions involving a cyclists and another road user were deemed to be as a result of a cyclist running a red light.
Logistics headaches 
Key facts:
Some will argue that cycling infrastructure will impair the delivery of goods in city centres, yet as shown in the video below consolidation centres and smarter delivery can not only up efficiency, but also lower costs. Curious if your business could save money?
Links:
- Make your deliveries by cargo bike and save your business substantial cost in cities
- GLS Italy turns to the cargobike for last mile delivery after positive trial, while Royal Mail’s 49,000 van fleet will continue to do the rounds.
- The art of carrying a load by bike
Bike Share schemes – do they work?
Key Facts: They do indeed work. The benefits are many fold, from re-introducing people to cycling, to easing city congestion. What’s more, many cities now have electric-assist hire bikes, meaning demographics that may not usual be comfortable cycling can now jump on stress free.
Links:
- Suppliers for bike share include, but are not limited to: PBSC, Motivate, Next Bike, Sycube, Cyclehop
- The presence of bike share reduces local congestion by 2-3%, on average.
- Societal benefits of bike share.
- Over ten million bike share journeys made in the UK – national body formed.
- Cycle hire spikes after the installation of cycle lanes in London
- The enormous pollution cut and economic potential of infrastructure supported bike share schemes
- How the bike shop (or individual) can create their own hire scheme at low cost
- Meet the bike shop making it work for business and tourism
- Success of bike share can often hinge on safe cycling infrastructure
Further reading for cycling advocates
Local Authority keen on cycling but unsure of best practice and how to implement? Perhaps send them on one of David Hembrow’s study tours. Hembrow’s blog; A View From The Cycle Path, is also a great read when it comes to cycling infrastructure.
The European Cyclists’ Federation – pooling knowledge from around the globe.
A site dedicated to debunking the common misconceptions related to cycling: cyclingfallacies.com
People For Bikes – a deep archive of research, studies and advocacy material for cycling.
Campaigning for off road trails? IMBA is a great place to start.
Rachel Aldred: Senior Lecturer in Transport at the University of Westminster
Katja Leyendecker: Researching the connections between power/politics, (cycle) infrastructure/urban environment and people’s perception.
The ‘Ultimate Guide to the Benefits of Biking‘ by Diane Cunnings.